Chainlink (LINK) has become a cornerstone of the Web3 ecosystem, powering reliable data connections between blockchains and the real world. As the leading decentralized oracle network, it underpins DeFi, gaming, and enterprise applications across 60+ blockchains. In this article, we explore the Chainlink forecast and Chainlink price prediction 2030, analyzing what could shape the token’s long-term outlook.
What Is Chainlink (LINK)?

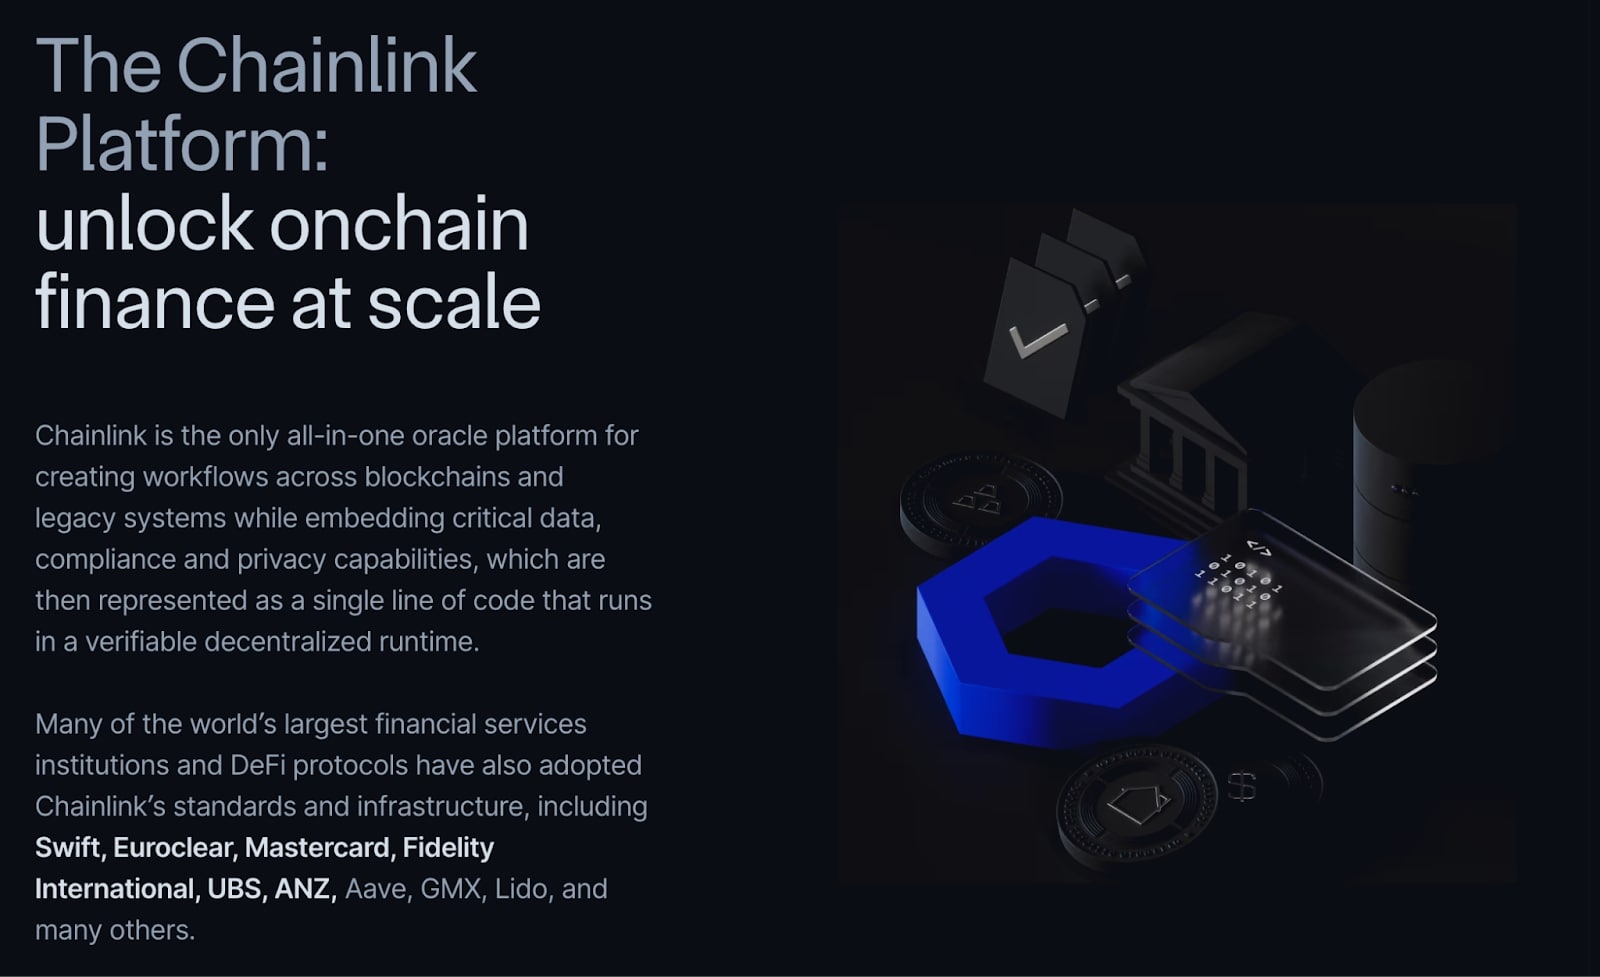
The Chainlink crypto platform is the top decentralized oracle network that bridges smart contracts with real-world data, powering reliable DeFi, gaming, and supply chain applications. Its core products include Price Feeds for trusted asset data, CCIP (Cross-Chain Interoperability Protocol) for seamless blockchain communication, and Proof of Reserve for transparent asset verification.
Supporting over 60 blockchains and partnering with major names like Mastercard, Fidelity, Aave, and GMX, Chainlink plays a vital role in connecting Web3 to traditional systems. Driven by its LINK token, the network rewards node operators for delivering accurate and secure data. With more than $93 billion in on-chain value secured in 2025, Chainlink continues to be a cornerstone of the Web3 ecosystem and one of the most important infrastructure projects in crypto.
Use our referral codes below to trade LINK on leading exchanges for the lowest fees, making it cheaper and easier to start investing.


Not your favorite exchange? Find more profitable codes in our crypto sign-up bonus list!
Chainlink (LINK) Price Prediction: How Do VentureBurn Experts Analyze It?
VentureBurn analysts use a combination of fundamental and technical factors to forecast LINK’s price. Their projections rely on historical price trends, statistical data, and various technical indicators such as RSI, MACD, support and resistance zones, trendlines, Fibonacci retracements, and momentum metrics.
To improve accuracy, the team integrates AI-driven models with manual expert evaluations. As always, this analysis is for informational purposes only and should not be taken as financial advice—investors are encouraged to conduct their own research (DYOR) before making any investment decisions.
The report also highlights that expectations of a potential Federal Reserve rate cut and a stronger risk-on sentiment in global markets are driving more capital into cryptocurrencies, including LINK.
Current Market Background
The United States economy enters August 2026 expanding at a moderate yet slowing pace, with second-quarter GDP growth easing to 1.5%. While consumer spending and labor markets demonstrate underlying resilience with low unemployment near 4.2%, persistent inflationary pressures remain a critical challenge. The Fed’s preferred Personal Consumption Expenditures price index continues to hover above target at 3.7%, creating an uneven economic landscape defined by moderating growth and stubborn core costs.
Global markets face a complex geopolitical environment marked by volatile energy supply shocks and ongoing trade frictions. While recent diplomatic efforts have temporarily mitigated conflict in the Middle East and stabilized vital maritime trade corridors, broader structural tensions endure. Tariffs and supply chain disruptions continue to pass higher input costs to international markets, sustaining systemic uncertainty and capping investor appetite for higher-risk global growth assets.
Monetary policy remains firmly restrictive as the Federal Reserve keeps benchmark interest rates paused at 3.50%–3.75%. Internal FOMC divisions have surfaced, with hawkish members favoring rate increases to tame sticky inflation. Furthermore, the central bank’s reduced forward guidance amplifies market volatility, as futures pricing shifts away from expected interest rate cuts toward potential rate hikes, leaving broad financial markets exposed to prolonged monetary tightening and high borrowing costs.
LINK Technical Analysis

The asset remains in a prolonged macro downtrend following a steep drop from its previous major high around $14. This structural breakdown established a persistent sequence of lower highs, indicating that sellers have maintained primary control over the broader trend. After finding a temporary floor around $7.00, a relief rally attempted to push price action toward the $9.00 region, but intense overhead supply quickly capped momentum, sending the market back down into a local corrective phase.
Key Price Levels
Support Levels
- $7: The $7.00 region serves as the ultimate macro demand zone and foundational baseline on the chart. Having historically absorbed massive distribution, this level represents an area where institutional buying interest repeatedly steps in, effectively halting sharp sell-offs and sparking strong, sustained price bounces.
Resistance Levels
- $9.0: The $9.00 range acts as the primary overhead supply wall and immediate technical barrier. Consequently, buyers must decisively breach and reclaim this zone to clear local selling pressure and confirm a genuine bullish trend reversal.
What to watch closely
When investing in Chainlink, it’s important to keep an eye on its expanding role within the DeFi ecosystem, since growing demand for decentralized oracle services directly drives LINK’s value. Track key network metrics like total value secured (TVS) and node participation, which reflect real usage and overall network health.
Partnerships are another strong signal — collaborations with financial institutions and blockchain projects often accelerate adoption and enhance token utility.
From a technical perspective, watch the support and resistance zones, as these levels often act as key decision points for traders and can indicate shifts in market sentiment.
Finally, stay updated on regulatory changes and upcoming innovations like Chainlink’s Cross-Chain Interoperability Protocol (CCIP). These developments will play a major role in shaping Chainlink’s long-term position and competitiveness in the decentralized oracle market.
>>> Read more: XRP (XRP) Price Prediction 2025, 2026 to 2030
LINK Price Prediction 2026
| Time | Expected Price | Potential ROI |
| Q3 2026 | $8.45 | 1.64% |
| Q4 2026 | $8.46 | 1.81% |
LINK Price Prediction 2027
| Time | Expected Price | Potential ROI |
| Q1 2027 | $8.60 | 3.49% |
| Q2 2027 | $9.80 | 17.93% |
| Q3 2027 | $10.00 | 20.34% |
| Q4 2027 | $11.50 | 38.39% |
LINK Price Prediction 2028
| Time | Expected Price | Potential ROI |
| Q1 2028 | $13.12 | 57.88% |
| Q2 2028 | $12.16 | 46.33% |
| Q3 2028 | $16.00 | 92.54% |
| Q4 2028 | $15.20 | 82.91% |
LINK Price Prediction 2029
| Time | Expected Price | Potential ROI |
| Q1 2029 | $16.40 | 97.35% |
| Q2 2029 | $18.90 | 127.44% |
| Q3 2029 | $18.30 | 120.22% |
| Q4 2029 | $17.50 | 110.59% |
LINK Price Prediction For Years 2026, 2027, 2028, 2029, and 2030
| Year | Expected Price | Potential ROI |
| 2026 | $8.46 | 1.81% |
| 2027 | $11.50 | 38.39% |
| 2028 | $15.20 | 82.91% |
| 2029 | $17.50 | 110.59% |
| 2030 | $19.00 | 128.64% |
The forecasts are based on statistics, historical price patterns, and a variety of technical indicators, including RSI, MACD, support and resistance, trendlines, Fibonacci levels, and momentum. Trained AI models and manual reviews are also utilized to improve prediction accuracy. This information is provided for informational purposes only and does not constitute financial advice—always do your own research (DYOR)
>>> Read more: NEAR Protocol Price Prediction 2026, 2027 to 2030
Conclusion

In the current late-2026 market environment, where geopolitical friction and Federal Reserve rate uncertainties continue to weigh on investor sentiment, Chainlink (LINK) is consolidating around the $8–$9 range, building a solid base supported by strong fundamentals and key demand around $7. The platform’s expanding ecosystem and rising on-chain engagement highlight sustained institutional confidence despite broader macroeconomic headwinds.
While macro conditions remain cautious — marked by sticky inflation and a hawkish Fed policy stance — market sentiment could shift positively as systemic risks stabilize. Chainlink’s momentum is further anchored by major real-world adoption milestones, including its live integration with S&P Global to bring Stablecoin Stability Assessments (SSAs) on-chain, alongside the programmatic Chainlink Reserve mechanism that systematically converts protocol revenues into LINK open-market buybacks.
If global trade uncertainty eases and investors regain their appetite for risk-on assets, Chainlink remains strategically positioned to launch into its next bullish phase, testing key overhead resistance and expanding its influence across tokenized real-world assets (RWAs), DeFi, and cross-chain infrastructure.
LINK Price Prediction FAQs
Q: What will LINK be worth in 2030?
Based on our technical analysis and market outlook, Chainlink (LINK) is expected to trade around $19 by the end of 2030, with potential highs reaching up to $22, assuming continued ecosystem growth and positive market conditions.
Q: Can LINK reach $100?
Reaching $100 is possible in the long term, but it would require sustained network growth, mass adoption of decentralized oracles, and favorable market dynamics.
If Chainlink continues to lead in DeFi, real-world asset tokenization, and cross-chain interoperability, a $100 target could be achievable during a strong bull market cycle. However, such a milestone is more likely a multi-year goal rather than a short-term move.
Q: Does LINK have long-term potential?
Yes — Chainlink has strong long-term potential thanks to its crucial role as a decentralized oracle network connecting smart contracts with real-world data. Its growing ecosystem, integrations across multiple blockchains, and partnerships with major firms like Coinbase reinforce its leadership in both DeFi and traditional finance.
Innovations like the Cross-Chain Interoperability Protocol (CCIP) enhance Chainlink’s value by enabling seamless blockchain communication. As demand for secure and transparent data feeds rises — especially in sectors like gaming, insurance, and capital markets — Chainlink is positioned to remain a key player.
While competition and macro trends can influence performance, the project’s fundamentals support a bullish long-term outlook.
Q: What factors influence LINK’s price?
LINK’s price is driven by a combination of internal developments and external market forces:
- Network upgrades are improving speed, scalability, and security
- Ecosystem expansion through new DeFi, NFT, and Web3 integrations
- Market sentiment and liquidity, influenced by news, institutional inflows, and exchange activity
- Macroeconomic factors such as interest rates and regulations
- Competition from similar Oracle or blockchain solutions
- Network reliability and security, as technical issues, can impact investor confidence.
Strong fundamentals and consistent upgrades tend to support long-term growth, while poor sentiment or technical setbacks can cause temporary volatility.
Q: Is LINK a good investment for 2026?
Despite lingering macroeconomic caution and a restrictive Federal Reserve policy stance, Chainlink stands out as a foundational infrastructure play for the crypto market. Its core role in connecting smart contracts to real-world data and powering tokenized real-world assets (RWAs) makes it essential utility for both decentralized finance and institutional TradFi adoption.
Backed by strategic institutional integrations, technological upgrades like CCIP v1.5, and growing cross-chain security standards, LINK is well-positioned for resilient long-term growth as blockchain adoption and global financial tokenization expand.
Q: How accurate are LINK price predictions?
Crypto price forecasts always carry uncertainty due to market volatility. Our projections are based on technical indicators (RSI, MACD, Fibonacci, support/resistance), historical price patterns, and AI-enhanced modeling, reviewed manually for accuracy.
However, actual prices may vary from predictions. This content is for informational purposes only and should not be taken as financial advice — always do your own research (DYOR) before investing.
The post Chainlink (LINK) Price Prediction 2026, 2027 to 2030 appeared first on Ventureburn.